The electrical static and dynamic models, the voltage security criterion and the LPM computation procedure used are discussed in detail in [7]. We merely outline their salient characteristics to indicate their highly realistic character.
A 1200-bus modelling including subtransmission levels and distribution feeders is used while secondary voltage control is modelled both in the static and dynamic computations. As concerns the latter, a simplified mid-term voltage stability simulation is carried out to track the on-load-tap-changers, automatic shunt compensation, machine overexcitation limiters and coordinated secondary voltage control behavior, subsequently to a disturbance.
Pre- and post-disturbance LPMs are computed by simulating the system response if submitted to a steady load increase until a voltage instability is reached. The latter is identified according to the change in sign of the sensitivity of total reactive power generation to individual HV reactive demands.
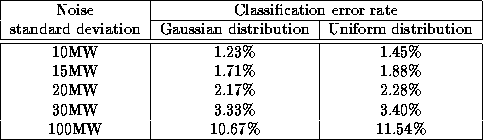
Table 1: LPM computation error vs classification
error
The standard deviation of the numerical computation error of the margin was estimated to about 15MW. Further, for a fixed regional load level, the standard deviation of the margin variation due to uncertainty in the load distribution as modelled in the data base is larger than 60MW. This estimates the LPM accuracy obtained via ``exact'' numerical computations. Using the latter to classify operating states of the data base, this uncertainty translates into classification errors in a way depending on the density of states in the neighborhood of the classification threshold. E.g., Table 1 shows the relationship between LPM computation noise and error rates, for a contingency corresponding to the loss of a generator in Plant 1, and classification with respect to a LPM threshold of 255 MW. The error rates are obtained by comparing the classification obtained by the computed margin, with the classification obtained by adding a noise term (assuming either a Gaussian or a uniform random distribution) to the computed margin. The figures are mean values and their standard deviation resulting from 20 passes through the data base with different random seeds.