Diagnostic Agent
Here, we consider observability as a closed loop mechanism for service assurance, as a foundational step towards intent-based networking.
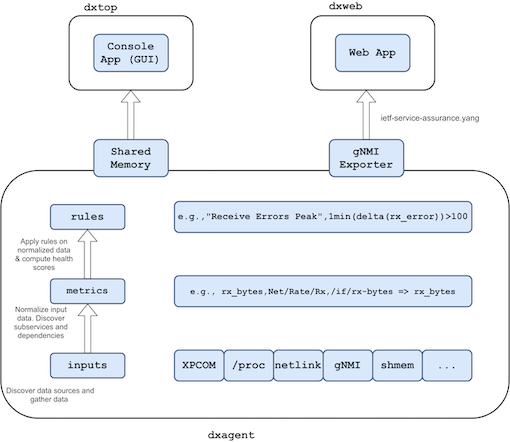
To do so, we have developped a diagnostic agent daemon, DxAgent (see Fig. 3).
First, it gather baremetal, VM and VPP data via multiple means. Second, it
normalizes collected data and discovers the active subservices and their
dependencies, and build a graph of it. Third, it checks for symptoms based
on user-defined rules applied to normalized metrics, computes subservices
health scores, and propagates health scores along the subservice dependency graph.
RFCs/Internet Drafts
- B. Claise, J. Quilbeuf, P. Lucente, P. Fasano. YANG Modules for Service Assurance. Internet Engineering Task Force. Internet Draft (Work in Progress). July 2020.