In-Situ Operations, Administration, and Maintenance (IOAM)
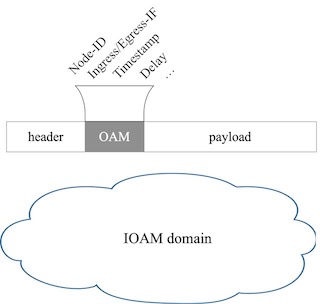
Operations, Administration, and Maintenance (OAM) refers to a set of techniques and mechanisms for performing fault detection and isolation, and for performance measurements. Throughout the years, multiple OAM tools have been developed for various layers in the protocol stack, going from basic traceroute to Bidirectional Forwarding Detection (BFD). Recently, OAM has been pushed further through In-Situ OAM (IOAM). The term "In-Situ" directly refers to the fact that the OAM and telemetry data are carried within packets rather than being sent through packets specifically dedicated to OAM. The IOAM traffic is embedded in data traffic, but not part of the packet payload.
In a nutshell, IOAM gathers telemetry and operational information along a path, within the data packet (see Fig. 1), as part of an existing (possibly additional) header. It is included in IPv6 packets as an IPv6 HopByHop extension header. Typically, IOAM is deployed in a given domain, between the ingress and the egress or between selected devices within the domain. Each node involved in IOAM may insert, remove, or update the extension header. IOAM data is added to a packet upon entering the domain and is removed from the packet when exiting the domain. There exist four IOAM types for which different IOAM data fields are defined:
- the Pre-allocated Trace Option, where space for IOAM data is pre-allocated;
- the Incremental Trace Option, where noting is pre-allocated and each node adds IOAM data while expanding the packet as well;
- the Proof of Transit (PoT);
- the Edge-to-Edge (E2E) option.
Trace and PoT options are both embedded in a HopByHop extension header,
i.e., they are processed by every node on the path. On the contrary, E2E option
is embedded in a Destination extension header, i.e., it is only processed
by the destination node.
Cross-Layer Telemetry (CLT)
Cross-Layer Telemetry (CLT) aims at making the entire network stack
(L2 → L7) visible for distributed tracing tools (e.g., Jaeger), instead of the
usual L5 → L7 visibility, leading so to a big impact on the industry as is allows
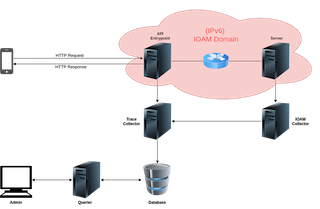
for more efficient application debugging. Fig. 2 illustrates how it works. The
IPv6 IOAM domain is where the magic happens. When a client request arrives, IOAM
headers are inserted in the IOAM domain traffic by the "API entry point" (see
Fig. 2) server and processed by each IOAM node on the path. Both the trace and
span IDs from the tracing tool are injected in IOAM headers to allow for a future
correlation. Then, an IOAM agent running on the end point server is responsible
for gathering IOAM data and for sending everything to the IOAM collector, which
one will correlate high level traces and network packets thanks to IOAM and
send the result to the trace collector. Traces are stored on a database from
where an operator can monitor them through a graphical user interface.
RFCs/Internet Drafts
- F. Brockners, S. Bhandari, D. Bernier. In-Situ OAM Deployment. Internet Engineering Task Force. Internet Draft (Work in Progress) draft-brockners-opsawg-ioam-deployment-02. September 2020.
- F. Brockners, S. Bhandari, T. Mizrahi. Data Fields for In-situ OAM. Internet Engineering Task Force. Internet Draft (Work in Progress) draft-ietf-ippm-ioam-data-11. November 2020.
- S. Bhandari, F. Brockners, C. Pignatoro, H. Gredler, J. Leddy, S. Youell, T. Mizrahi, A. Kfir, B. Gafni, P. Lapukhov, M. Spiegel, S. Krishnan, R. Asati. In-Situ OAM IPv6 Options. Internet Engineering Task Force. Internet Draft (Work in Progress) draft-ietf-ippm-ioam-ipv6-options-04. November 2020.