Challenge 5: Page Fault Frequency Monitoring
Page faults are a key indicator of a process’s memory behavior. They occur when a process accesses memory that is not currently mapped in its virtual address space.
When the sum of the working sets of all processes is greater than physical memory, thrashing occurs. However, approximating the working set of a process is difficult.
A solution to avoid thrashing is to measure the rate at which page faults occur (the Page Fault Frequency (PFF)) for each process, and try to keep it between two thresholds. If the low threshold is reached for a process, fewer frames can be given to it. If the high threshold is reached, more frames are given.
Note
Linux does not implement this mechanism; it relies on other strategies or let the user intervene manually (e.g., by killing processes).
In this challenge, you will develop an eBPF program that monitors the PFF of a specific process and notifies user space when the rate falls outside a desired range.
Description
By page fault, we mean the generic situation where a program tries to access a page of memory that is not currently mapped in its virtual address space. This can happen for example when a program accesses memory for the first time, or when it tries to write to a read-only page. In both cases the kernel must intervene, which can be costly in terms of performance. Note that this includes both soft and hard page faults; we treat them uniformly here for simplicity.
The PFF is defined here as the number of page faults that occurred during a
time frame of T milliseconds. Your eBPF program must monitor the PFF of
the process named page_fault_gen and send a message to user space via a
perf buffer whenever the PFF goes out of the desired range:
"PFF too high for process with PID %d"if the PFF exceeds the upper bound U (i.e. more than U page faults occurred in the last T milliseconds)."PFF too low for process with PID %d"if the PFF drops below the lower bound L (i.e. fewer than L page faults occurred in the last T milliseconds).
Note
The lower bound check is more subtle than the upper bound check. You can detect that the PFF is too high as soon as a new page fault is recorded (since you have all the information you need at that point). However, to detect that the PFF is too low, you need to act even when no page fault is occurring — you must therefore schedule a check for the future.
Setup
Download the files for this challenge using:
$ wget --no-check-certificate https://people.montefiore.uliege.be/~gain/courses/info0940/asset/page_faults.tar.gz
$ tar -xzvf page_faults.tar.gz
The page_fault_gen program is located in page_faults/page_fault_gen.
You can compile it using the Makefile provided (simply run make within the
page_fault_gen/ directory). It takes 3 arguments:
$ ./page_fault_gen <min_frequency> <max_frequency> <period_ms>
This program will generate page faults between the specified minimum and
maximum frequencies (in page faults per millisecond), with a period of
period_ms milliseconds. The oscillation follows a triangular wave pattern,
meaning that the frequency will linearly increase from the minimum to the
maximum, then linearly decrease back to the minimum, and so on.
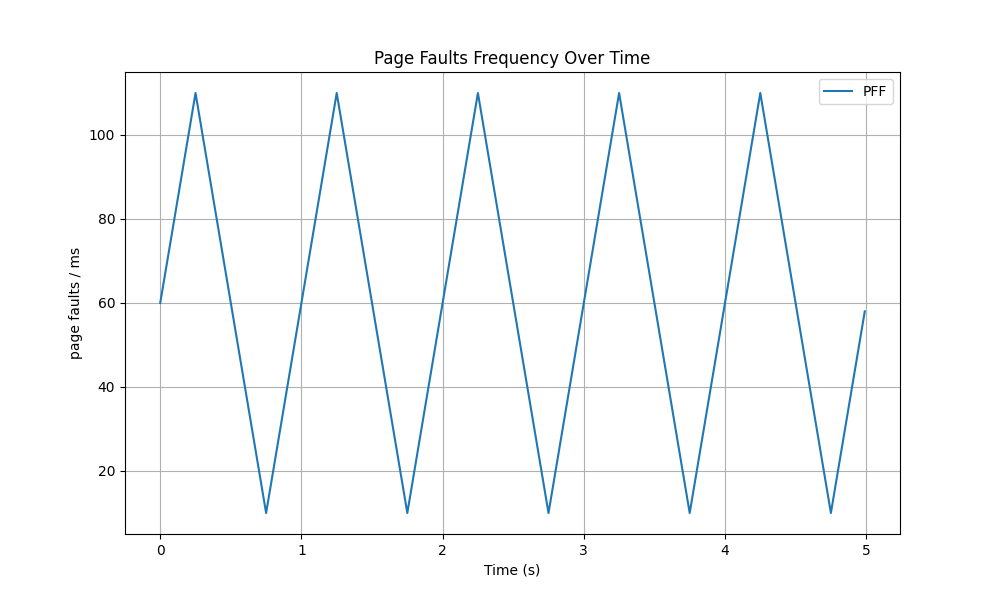
For example, if you use
$ ./page_fault_gen 10 110 1000
The oscillation will look like this during the first few seconds:
You can also generate a constant frequency by setting the minimum and maximum frequencies to the same value:
$ ./page_fault_gen 50 50 1000
Continuously generating page faults at a constant frequency of 50 page faults/ms
Important
If you try to generate too much page faults by setting the
maximum frequency too high, your machine won’t be able to keep up and the
actual frequency will be much lower than the one you set. A check has been
added in page_fault_gen to warn you if you are more than 1 second behind
the expected oscillation:
$ ./page_fault_gen 500 500 1000
Continuously generating page faults at a constant frequency of 500 page faults/ms
Warning: You are way behind schedule, your machine can't keep up with the target frequency. Consider reducing max_frequency.
This is especially important to keep in mind if you are emulating your machine (e.g., using QEMU). In that case, consider reducing all frequencies by a factor of 10 (e.g., using 5 and 50 instead of 50 and 500) to ensure that your machine can keep up with the target frequencies.
You can use it to test your eBPF program by setting the rate above, below, or within the desired range.
Inside page_faults/src, you will find the same template as in tutorial 3.
Use it to implement your eBPF program.
What you need to do
Implement an eBPF program that monitors the PFF of the page_fault_gen
process and sends a message to user space via a perf buffer whenever the PFF
goes out of the desired range. The following parameters must be configurable
from the command line when loading the eBPF program:
--upper_bound_freq_ms: The maximum number of page faults allowed per millisecond. Combined with--time_window_ms, this gives the maximum number of page faults allowed in the time window. Default should be 100 page faults/ms.--lower_bound_freq_ms: The minimum number of page faults expected per millisecond. Combined with--time_window_ms, this gives the minimum number of page faults expected in the time window. Default should be 10 page faults/ms.--time_window_ms: The duration of the sliding time window in milliseconds. Default should be 50. The upper bound count (the number of page faults allowed in the time window) will never exceed 10000 (i.e.upper_bound_freq_ms * time_window_ms <= 10000).
Note
It is acceptable for the eBPF program to print multiple messages for the same violation if the PFF remains out of range across multiple checks. The key requirement is that it should print a message at least once when a violation occurs.
You should not print any “too low” message before page_fault_gen has
started generating page faults.
Since it is acceptable to print multiple messages for the same violation, the eBPF program could flood your terminal with messages. To avoid this, you can redirect the output to a file and check it after stopping the program.
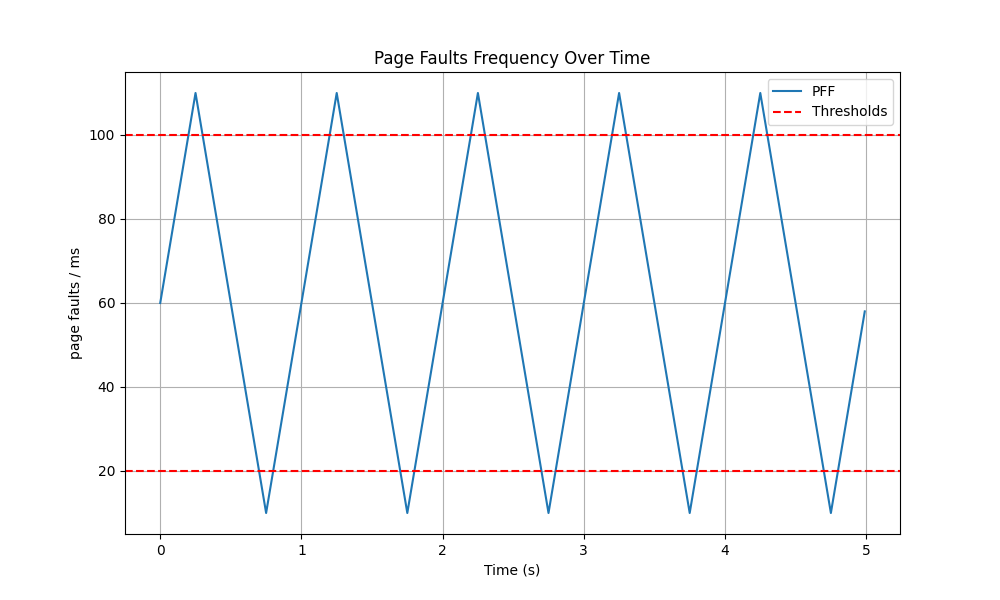
For example, if you launch this command in a first terminal where you redirect
the output to the file /tmp/ch5_output:
$ sudo ./prog --lower_bound_freq_ms 20 --upper_bound_freq_ms 100 --time_window_ms 10 > /tmp/ch5_output
And this command in another terminal:
$ ./page_fault_gen 10 110 1000    # Oscillating between 10 and 110 page faults/ms every second
Reached max frequency: 110 page faults/ms
Reached min frequency: 10 page faults/ms
[...]
Reached min frequency: 10 page faults/ms
Reached max frequency: 110 page faults/ms
Reached min frequency: 10 page faults/ms
You can then stop the eBPF program and check the output in /tmp/ch5_output
to see if the correct messages were printed. Since you can print multiple
messages for the same violation, you can use the uniq command to filter out
duplicates:
$ cat /tmp/ch5_output | uniq
PFF monitor: lower=20, upper=100, window=10ms
Monitoring started (filtering by process name). Press Ctrl+C to stop.
PFF too high for process with PID 35180
PFF too low for process with PID 35180
[...]
PFF too high for process with PID 35180
PFF too low for process with PID 35180
PFF too high for process with PID 35180
PFF too low for process with PID 35180
Note
The last message about the PFF being too low is because the program was stopped and thus produced no page faults for a while, which caused the PFF to drop below the lower bound.
Note on timers and timestamps
To monitor the PFF, you need a precise notion of time. The upper-bound check is relatively straightforward because it is event-driven: every time a page fault occurs, your eBPF program is triggered. It can immediately look back at previous timestamps to determine if the frequency is too high.
However, the lower-bound check requires a different architectural approach. You must detect when the PFF is too low, which happens precisely when too few or no page faults are occurring.
Why not use an eBPF timer?
A natural first thought is to use the eBPF timer API (bpf_timer) directly
in kernel space to trigger a callback when time expires. However, tracing
programs like kprobes have strict limitations and generally cannot utilize
bpf_timer hooks in the way networking programs can.
Therefore, the lower-bound detection must be handled in user space. You are expected to performs the fewest checks possible for the lower bound (ideally just one check every time the PFF could potentially drop below the lower bound). If that seems too complicated for you, you are allowed to check periodically (e.g., every 10ms) instead, but you will have a penalty of -1/20 points for the project.
Matching Kernel and User Space Clocks
When recording timestamps in your eBPF program, you will use the
bpf_ktime_get_ns() helper. This returns the time in nanoseconds using the
kernel’s CLOCK_MONOTONIC (the time elapsed since the system booted).
Because your user-space C code will be comparing these kernel timestamps against the “current time” to calculate deadlines, it is important that both environments use the exact same clock.
Warning
Do not use standard time functions like time() or gettimeofday() in
user space! These functions return “wall-clock” time (CLOCK_REALTIME).
Wall-clock time can drift, jump backwards due to NTP synchronization, or
change if the user updates the system time. Mixing them with kernel
monotonic timestamps will result in incorrect window calculations.
Instead, you can define a helper function in your user-space code that
retrieves the current time in nanoseconds using the same CLOCK_MONOTONIC as
the kernel. You are allowed to copy-paste this function into your code:
// Current CLOCK_MONOTONIC time in nanoseconds (same clock as bpf_ktime_get_ns).
static unsigned long long now_ns(void)
{
    struct timespec tp;
    clock_gettime(CLOCK_MONOTONIC, &tp);
    return (unsigned long long)tp.tv_sec * 1000000000ULL
         + (unsigned long long)tp.tv_nsec;
}
Tips and Remarks
Using Arrays: The same tip from challenge 4 applies here: use a
BPF_MAP_TYPE_ARRAYkeyed by a slot index to store the timestamps of the last n page faults, rather than embedding an array inside a map value struct.The Startup Phase (1): Do not evaluate the lower-bound condition until at least one full time window has elapsed since the first observed page fault.
The Startup Phase (2): When testing your code, if you set the higher bound too low, you may get “too high” messages during the startup phase. This is because when the monitored process starts, it will generate page faults to load its code and data into memory (It should generate approximately 50 page faults at that time). This behavior is normal and expected.
Architecture Dependencies: Pay attention to the fact that much of the code related to page faults is architecture-dependent. There is however a key function where page fault handling begins that can be hooked across all architectures. The following resources can help you identify it: mmu-tlb-and-page-faults and chapter 4.6.1 Handling a Page Fault.
Approximation: The
page_fault_genprogram tries to generate page faults at the frequencies you specify, but the actual frequencies will not be as smooth as the ideal triangular wave. This is because the process of generating page faults involves some overhead and cannot be perfectly precise. If you set the thresholds too close to the target frequencies, you may see some “too high” or “too low” messages even when the generator is working correctly. This is normal and expected.